Danh mục sản phẩm

Hỗ trợ trực tuyến
0943.545.248
Email: thutrang2501bn@gmail.com


ĐỒ BÓNG CHUYỀNXem thêm
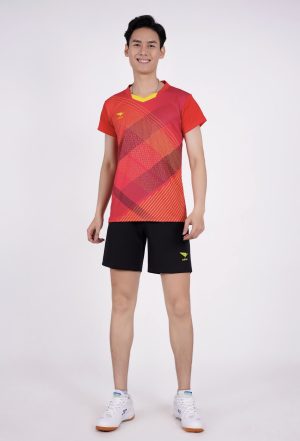
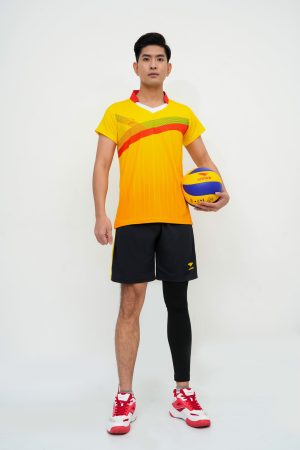
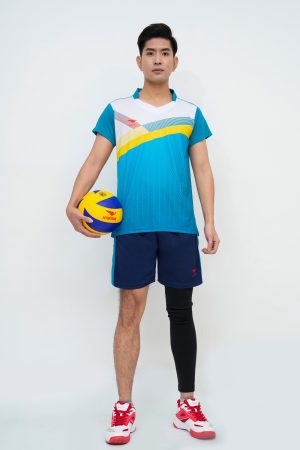
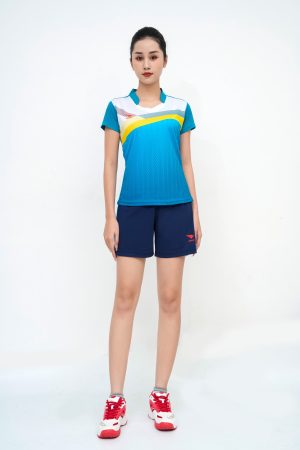
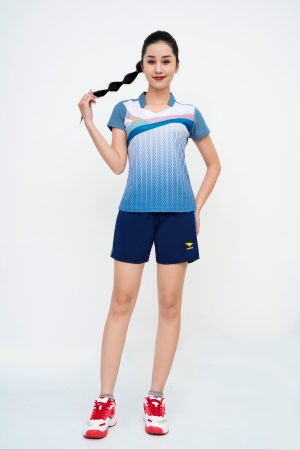
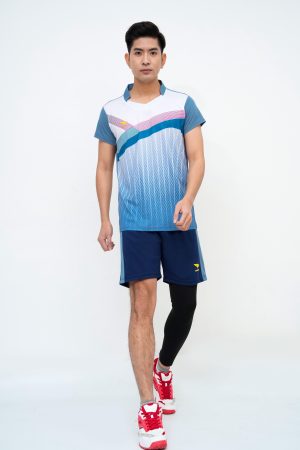
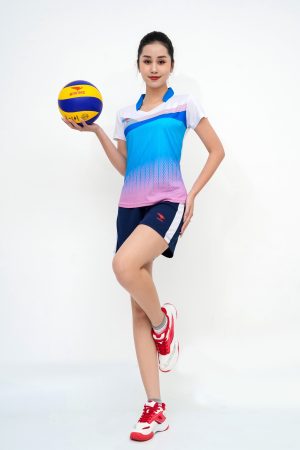
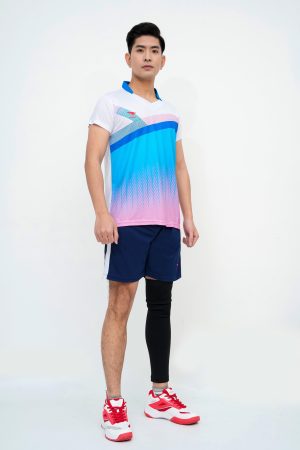
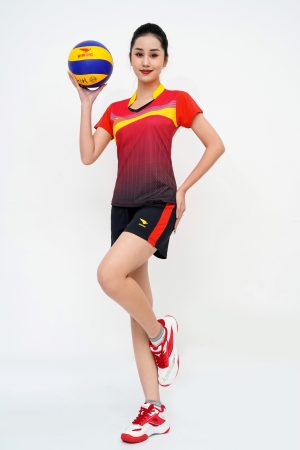
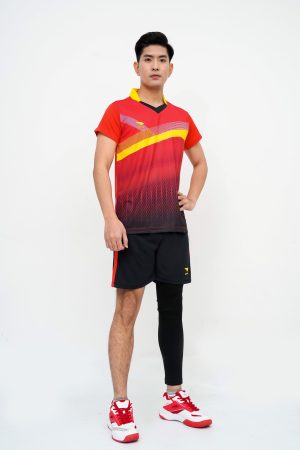
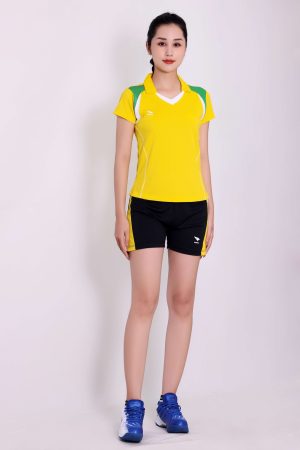
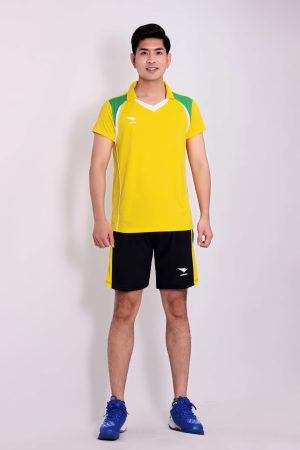
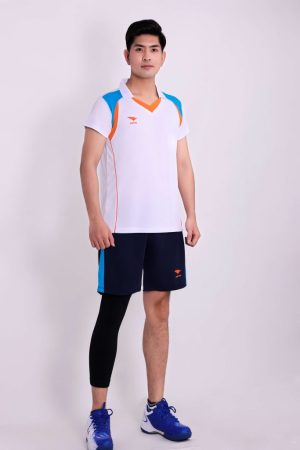
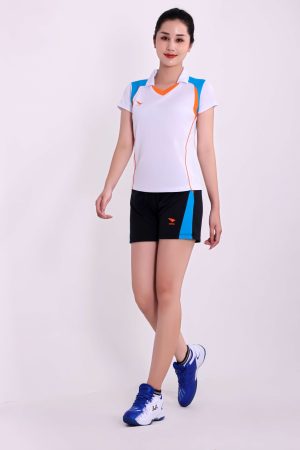
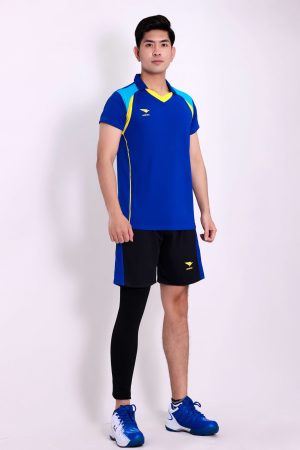
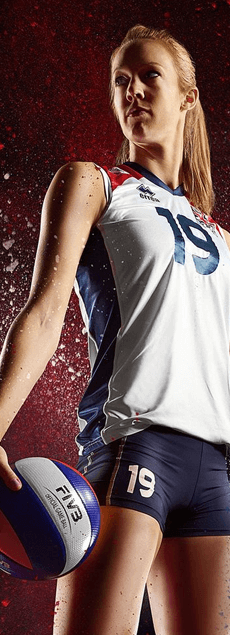
- Áo bóng chuyền cao cấp nam nữ chính hãng
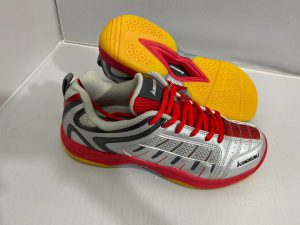
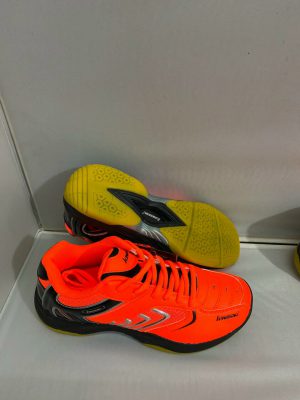
- Giày bóng chuyền chính hãng
- Phụ kiện bóng chuyền: Lưới, trụ bóng truyền
- Quả bóng chuyền chính hãng giá rẻ
ĐỒ BÓNG ĐÁXem thêm
- Áo bóng đá giá rẻ đẹp mới nhất 2019-2020
- Áo lót bóng đá
- Áo tập bóng đá
- Đồ thủ môn
- Giày bóng đá
- Phụ kiện bóng đá
- Quả bóng đá
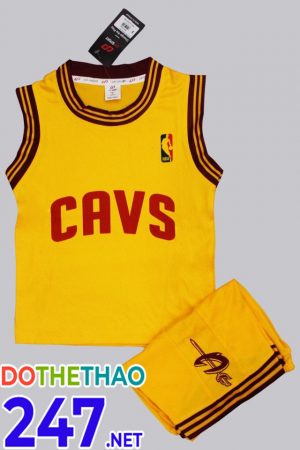
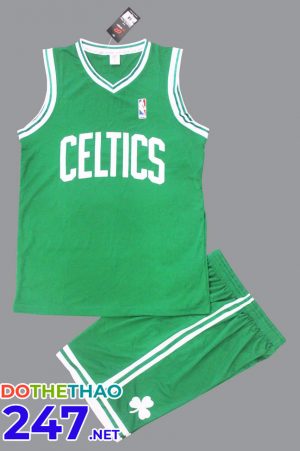
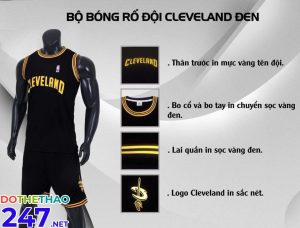
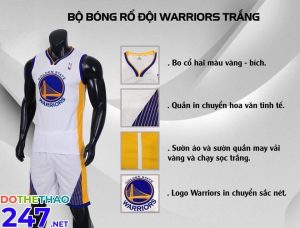
ĐỒ BÓNG RỔXem thêm